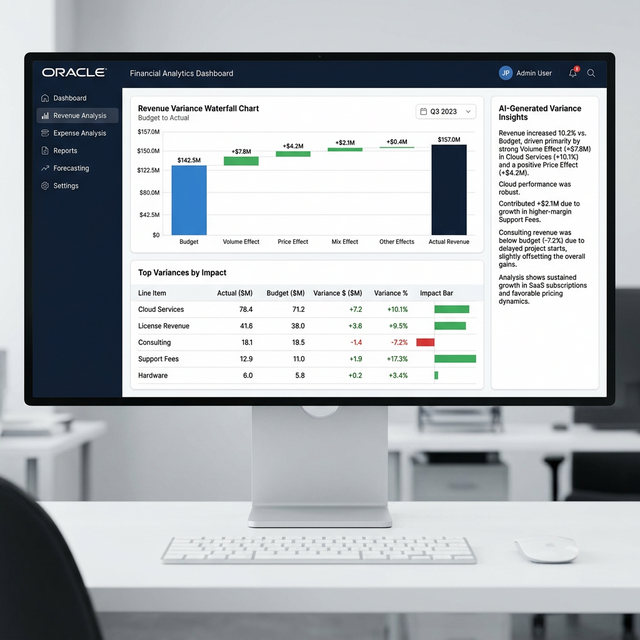
AI-Powered Financial Analysis
& Variance Insights
How a fast-growing tech company shifted from reactive financial reviews to proactive, AI-driven insight - saving 220+ hours annually.

Financial Reviews Shouldn't Take Days
Every month, finance teams spend days reviewing financial statements line by line. They catch some variances. They miss others. And by the time the analysis is done, the business has already moved on.
For growing companies, the problem compounds. More accounts, more cost centers, more business units - and the same size team trying to review it all. The traditional approach doesn't scale.
Enterprise FP&A tools solve this for large corporations. But mid-market tech companies running Oracle, SAP, or NetSuite often make do with Excel pivot tables and manual commentary. That's where this client was stuck.
Meet the Client
A fast-growing technology company with $120M in revenue, running Oracle as their ERP. Their 8-person finance team handled monthly and quarterly close across 4 business units.
Every close cycle, two senior analysts spent 12-18 hours reviewing P&L variances across all business units. They pulled Oracle reports, exported to Excel, sorted by variance percentage, and investigated each line item manually.
The irony: they spent most of their time investigating variances that turned out to be immaterial. Meanwhile, genuinely significant signals - a pricing erosion in one product line, a staffing inefficiency in another - were buried in the noise.
The issue wasn't effort - it was signal-to-noise ratio. The company had excellent Oracle data. But without a systematic way to rank variances by dollar impact and connect them to business drivers, reviews were slow, inconsistent, and reactive.
The Manual Review Cycle
The result: leadership got thick slide decks full of numbers but light on insight. Action items were vague. And the same variances kept showing up month after month because there was no systematic way to track whether corrective actions had worked.
How We Built the AI Solution
We designed an AI-powered financial statement analysis platform fully integrated with Oracle. Instead of reviewing every variance, the system analyzes results through the lens of business drivers - automatically.
The AI ranks every variance by dollar impact on revenue, margin, and EBITDA - not by percentage. This means the finance team stops investigating $2K variances that are 50% off budget, and starts focusing on the $200K variances that move the business.
Every flagged variance comes with a plain-language explanation - what happened, which driver caused it, and what corrective action might be appropriate. Finance teams review and refine AI-generated insights instead of writing commentary from scratch.
Impact-Weighted Detection
Variances ranked by dollar impact on revenue, margin, and EBITDA - not percentage noise
Natural-Language Narratives
Every flagged variance includes a clear, plain-language explanation of the underlying driver
Closed-Loop Learning
Actuals feed back monthly, improving assumptions and surfacing recurring misses
Weekly Action Dashboards
Concrete recommendations - utilization improvements, pricing adjustments, or cost controls
Before vs. After
Results That Shift the Function
(was 12-18 hrs)
annually
identification
from efficiency
The bigger impact wasn't the hours saved - it was what the team did with those hours. Finance shifted from explaining history to guiding the business forward. Weekly action dashboards replaced monthly slide decks. And for the first time, leadership had real-time visibility into the drivers behind their numbers.
Still Reviewing 500 Lines by Hand?
If your finance team spends more time investigating noise than acting on signal, there's a better approach. We'll show you how AI can surface the 10 items that matter.
Get a free workflow analysis →8-Week Rollout
Weeks 1-2: Connect
Oracle data extraction, driver mapping, chart of accounts alignment, and baseline AI variance logic.
Weeks 3-4: Build
Impact scoring engine, interactive dashboards, and automated narrative generation for each driver.
Weeks 5-6: Learn
Closed-loop learning system, weekly action modules, anomaly detection, and historical pattern training.
Weeks 7-8: Launch
User training, parallel testing vs. manual reviews, feedback calibration, and full production rollout.
"Finance shifted from explaining history to guiding the business forward. We now deliver weekly, actionable insight on the drivers that actually matter - not just a wall of numbers. Our board presentations went from 40 slides of data to 10 slides of strategy."

Frequently Asked Questions
Stop Reviewing History.
Start Driving the Business.
Book a free 30-minute call. Walk away with a workflow map, quick-win list, and a start-here plan - whether you work with us or not.
Book a free call →